Latitude vs Max Temperature
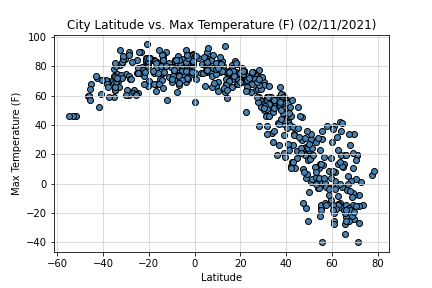
The scatter plot above shows the relationship between the maximum temperature and the city latitude. Typically temperature gets higher as you get closer to 0 latitude and lower as you move into the higher latitudes.
Plots
Latitude vs Max Temperature
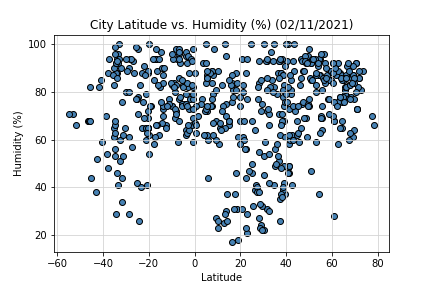
Latitude vs Humidty (%)
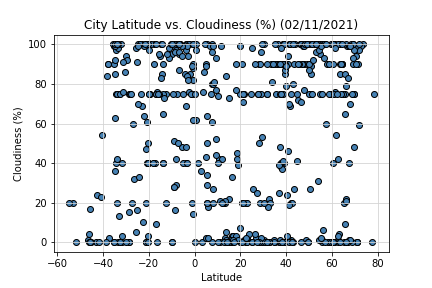
Latitude vs Cloudiness (%)
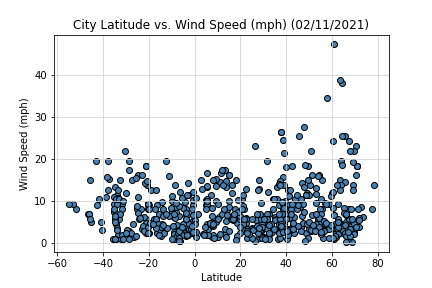
Latitude vs Wind Speed (mph)